I pulled all the publicly available padró municipal data for Barcelona and built an interactive explorer. The padró is the census register. Every municipality in Spain keeps one. Barcelona publishes theirs with neighbourhood-level detail going back to 1997. That is 29 years across 73 barris.
The city grew from 1.48 million to 1.73 million. That number on its own tells you nothing. The barri-level numbers tell you everything.
Two immigration waves, not one
In 1997, 3.3% of Barcelona’s residents were born outside Southern Europe. By 2025, 33.4%.
The first wave hit between 2000 and 2005. The foreign-born share jumped 11 percentage points in five years. Mostly South American. Ecuador, Colombia, Bolivia, Peru. That wave plateaued around 2010.
Then a second wave started building around 2016. By 2020-2025 the rate of change is back to where it was in the early 2000s, adding 7 percentage points in five years. This one is more diverse. South Asia, Central America, Eastern Europe.
Most people talk about Barcelona’s immigration as one event. The data shows two distinct surges with a quiet period in between.
The Gòtic is an outlier in every direction
El Barri Gòtic went from 9% foreign-born to 72%. It doubled in population. Its median age dropped from 48 to 35. It went from 52% female to 36% female.
No other barri in Barcelona comes close to that combination. It is the youngest, the most male, the most foreign-born, and it had the largest population swing. It also did something unusual: it shrank by 43% between 2005 and 2015, then grew 80% between 2015 and 2025. Two extreme movements in opposite directions within 20 years.
Youth and elderly nearly crossed
In 1997 the under-25 population was 25.6% and over-65 was 20.8%. A gap of 4.8 points. By 2015 that gap closed to 0.1 points. They almost crossed. Then immigration pushed the youth share back up slightly. In 2025 the gap sits at 0.6 points. Barcelona came within a fraction of becoming a city with more pensioners than young people.
13 barris got younger and more foreign at the same time
Normally an ageing neighbourhood stays ageing. Immigration reversed that in 13 barris. El Raval dropped 10 years in median age while going from 11% to 63% foreign-born. Montbau dropped 10 years while going from 2% to 29%. El Turó de la Peira dropped 9 years.
Without immigration these neighbourhoods would have continued ageing. The new residents are younger and they brought the median down.
Sants-Badal is the densest neighbourhood at 61,000 per square kilometre
That is denser than most of Manhattan. The barri is 0.41 square kilometres with 25,000 people. Verdun is second at 57,000. At the other end, Vallvidrera has 426 people per square kilometre.
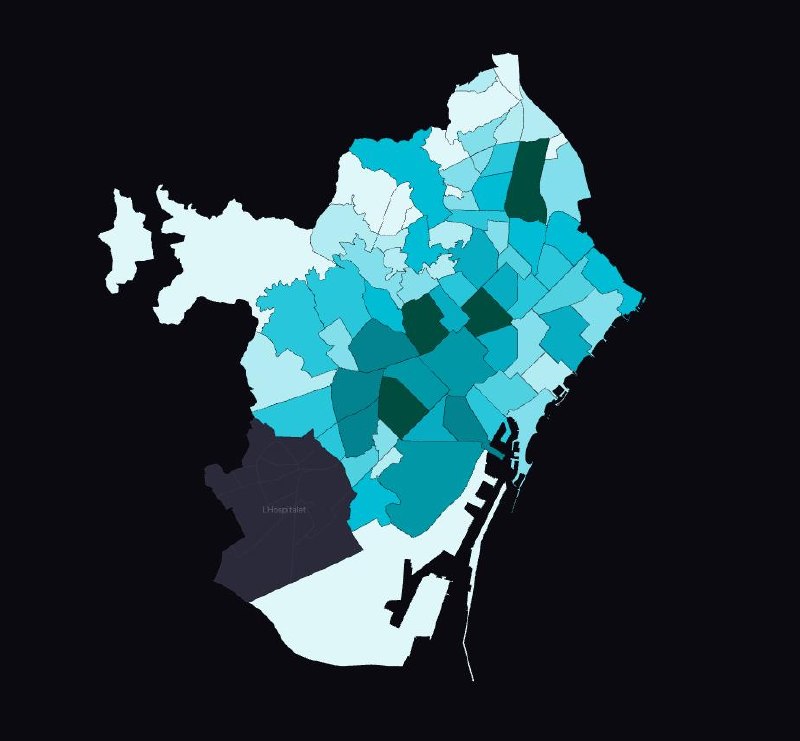
L’Hospitalet is 42% foreign-born
L’Hospitalet de Llobregat sits directly west of Barcelona. Same metro area. 784,000 people. In 1997 it was 2.6% foreign-born. In 2025 it is 42%. Higher than Barcelona.
Their open data is better than Barcelona’s. They publish country-level birthplace data for 184 countries. Barcelona only publishes 23 aggregated world regions. In L’Hospitalet you can see that in 1997 the largest foreign group was Moroccans at 1,689 people. By 2025 it is Ecuadorians at 13,415, followed by Peruvians at 12,343 and Colombians at 10,826.
The visualisation includes both cities. Click the city name in the header to switch. They appear on each other’s maps as grey shapes you can click.
The visualisation
The explorer has a choropleth map with a year slider and eight metrics. Click any barri to get the full picture. Age pyramid. Birth origins. A sparkline over time.
Below the map there are small multiples. One chart per barri. Green means growing. Pink means declining. Hover for values.
Then two grids of stacked area charts for place of birth and nationality. You can watch each barri’s composition shift from the late nineties to now.
Colour
The map uses a blue-green palette. Human colour discrimination peaks around 490 to 500 nanometres. We can distinguish about 40 hue steps there. In the yellow range it is closer to 8 or 10.
Data
Barcelona: Open Data BCN. Three datasets. Age by sex. Birth region. Nationality region. 29 annual CSVs each.
L’Hospitalet: seu-e.cat. Two CSVs. Territory by age and sex. Nationality by birth country. Goes back to 1994.
Map boundaries from martgnz/bcn-geodata and L’Hospitalet’s territorial divisions dataset.